In mid-April 2013, the exhibition area GeoCity at the Ars Electronica Center gets a basic update. Thus, the interactive city and geographic information system SimLinz will be extended with new data and functionalities, comparisons with other cities around the world will be possible, too. Read the interview with Michael Badics – he and Bernd Albl are the heads of the Ars Electronica Solutions, but Badics is also responsible for the redesign of the GeoCity.
What can we look forward to seeing in the reconfigured area of GeoCity?
First of all, the new area in GeoCity reflects the ongoing development of Geopulse, our product that’s recently been enhanced with new features. Plus, visitors now get a chance to undertake an intensive encounter with urban life in light of the fact that the city will be the predominant setting for human existence in the foreseeable future. In 2050, about 85% of humankind will be city dwellers, which also means major challenges for the cities themselves. In fact, the current problems of the world’s megacities are already indicating the issues cities are going to have to come to terms with.
So this is what might be called a platform for information about the city?
Geopulse isn’t only a resource and tool to enable citizens to work with information about the city in a way in which they can truly make sense of it; it’s also a planning instrument for urban development itself. We’re making an effort to illustrate this in our various versions of Geopulse—for example, a project in Beijing in which Geopulse is being developed much more in the direction of a simulation than as a tool to administer infrastructural planning in conjunction with the numerous fundamental problems a city has to master such as traffic, waste management and delivery of utility services like water and energy.
Nevertheless, it still serves primarily as an information retrieval tool to enable people to easily access complex and highly recondite information about the city. And to do it in a visual way that lets people comprehend all these statistics and complicated data. An essential objective of this product and the installation in Linz is to make available information and content about the city in a user-friendly way to human beings, to normal residents of a city.
How did this project originate?
It actually began when the City of Linz approached us to rework the city model that, by the way, is still on display in Linz’s Neues Rathaus. The assignment was to produce a digital version capable of a lot more than just depicting the cityscape—which is, of course, something a physical model does very well. This digital city model was to be designed to encompass all the various aspects of urban life including, above all, its historical development, and that’s what we ultimately came up with in 2007. SimLinz for GeoCity in the Ars Electronica Center was an upgraded spinoff of this first version. We pursued this idea further, and in doing so we realized that this is a practical tool not only for Linz but for other cities as well, and can be informative for tourists and locals alike.
In what ways is information about a city useful to its citizens?
This is first and foremost a matter of comprehending the steps a city takes—what measures it has initiated in the past and what it’s planning for the future. Why are certain measures necessary in this city? This is easier to understand when, for example, traffic data can be visualized and people can see in real time where there are bottlenecks on the streets at what times of day and night. And this makes it clear that urban planning measures are necessary—for instance, a new bridge over the Danube in Linz. With the Geopulse installation, citizens can get access to the information that went into reaching particular decisions. Here we might briefly mention the Open Data initiative that has attracted so many new members in recent years, and the fact that Linz is one of the first cities in Austria to get involved.
A lot is moving in the direction of real-time information, which this tool can also be used to depict, so we’re not just talking about statistical information, though this is also extremely interesting when it’s observed over a certain timeframe. A column of figures about the development of kindergartens in Linz over the last 30 years doesn’t make a real statement until the data are visualized and you get an impression not only of where these changes have occurred in the Linz metro area but you can also grasp the magnitudes. Cities implement a variety of programs in various areas such as social welfare, health and traffic, and maybe the citizenry isn’t totally cognizant of all that’s actually been done.
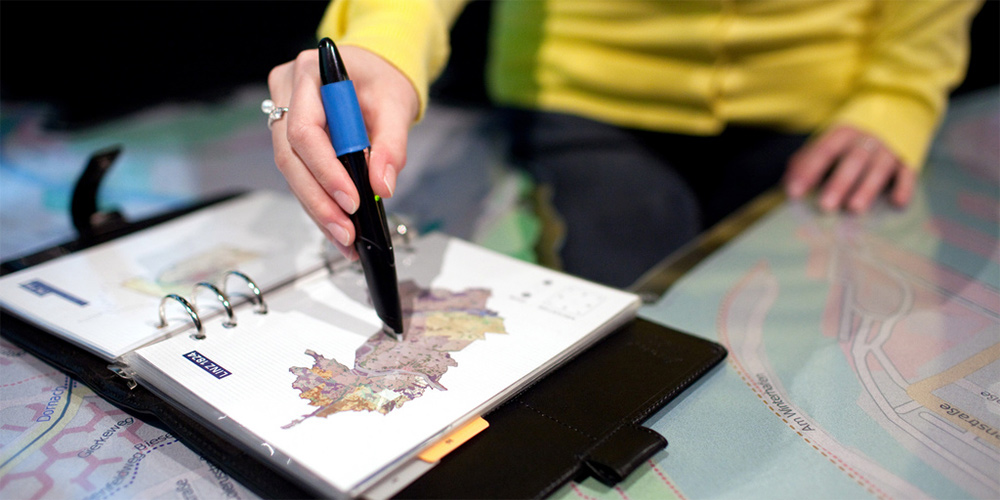
In Geopulse, users move through the city with a digital pen. To what extent is this interface actually the key to finding out what you want to know about the city?
The interface plays such an important role because it’s conducive to the installation’s aim: to inform a broad spectrum of users about the city and to make the content available in such a way that everybody can understand it. So what does this actually mean in a city? Approximately 50-60% of the urban populace is over 40 years of age, and many members of this age group of “digital immigrants” have difficulty using new technologies. But this large group of people ought to also have the chance to access data about the city in digital form. That’s the reason for this interaction mode and the pen metaphor. Here, we have recourse to traditional cultural artifacts, a book and a pen, and turn the technology of the digital pen around. What we put into people’s hands is the possibility to use a tool everyone’s familiar with to explore the city and to access information that would otherwise require a certain degree of experience in using modern technology.
I’m often asked why a touch-interface and lots of other things weren’t employed. We made an intentional decision to go with equipment that all members of our target audience are familiar with and can use. And nevertheless there’s something magical about this—when you can use an electronic pen to navigate through digital worlds in which you normally have to rely on high-tech interfaces to get around. And even if multi-touch is “normal” for just about everyone nowadays, there’s still a very large group of people for whom it’s not the least bit normal. This is why I consider the pen a very important element.
Now it’s Linz’s turn. A couple of months ago it was Beijing. What’s the next step in this product’s development?
The development of the Geopulse product is going full speed ahead. We’re not only continuing here at the Ars Electronica Center Linz by launching this new version with added data and new features; parallel to this, we’re progressing in Beijing too. Meanwhile, we’ve also been receiving inquiries from many other cities—Berlin; Fribourg, Switzerland; Moscow; Saragossa, Spain to name just a few. So you can see that there’s tremendous interest in establishing a platform that’s capable of doing a lot more than just complying with a municipality’s duty to provide information to its citizenry.
There’s demand to also be able to use the data internally in order to make it possible to instantaneously recognize certain processes taking place in the city by visualizing and simulating them, and interlinking them with other data that are difficult to interrelate on paper or with other means. This yields results and insights that are interesting for the process of urban development itself.